Tutorial
Query Submission
The PDBms tool allows you to submit your query as PDB ID search and PDB file upload.
PDB ID Search
The PDB ID search is an instant search that allows you to know the availability of a PDB file from the RCSB PDB server by typing a 4‑digit PDB ID in the textbox. After a successful search for PDB ID, click the “Analyze” button to begin analyzing the PDB file for macromolecules and small molecules from the complex.
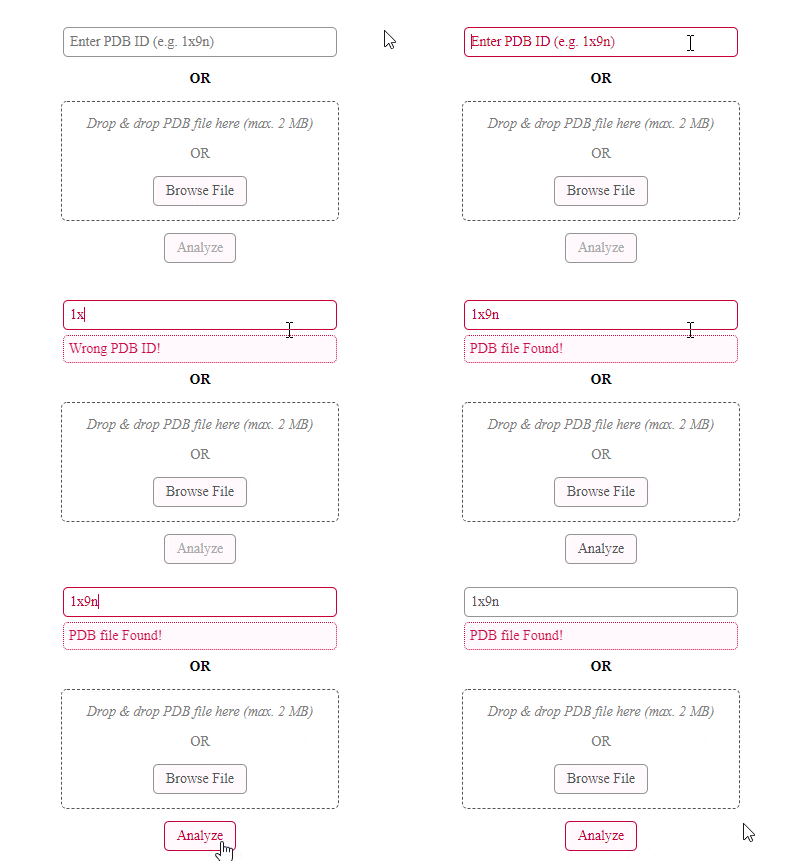
While typing the PDB ID in the textbox, the status of availability of the PDB file is displayed below.
PDB File Upload
The PDB file upload method allows users to submit their PDB file to analyze the macromolecules and small molecules from the complex. It is simply done by dragging and dropping the PDB file to the upload area or browsing and uploading your PDB file by clicking the “Browse File” button.
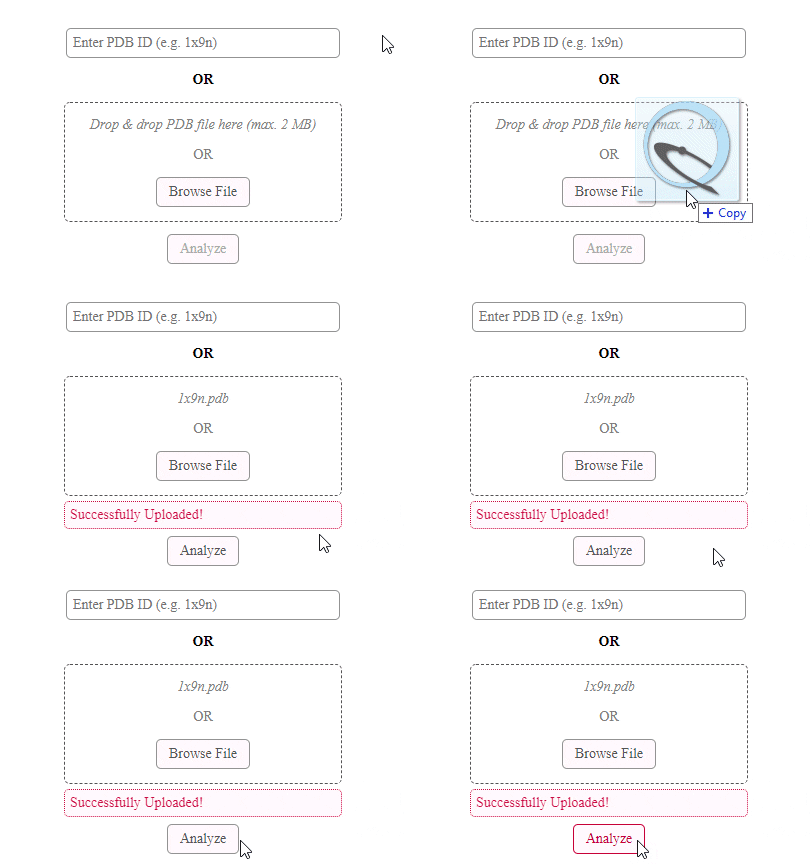
While uploading the PDB file, the status of the upload process is displayed below. After the successful file upload process, click the “Analyze” button to start analyzing the PDB file for macromolecules and small molecules from the complex.
Analyzing PDB File
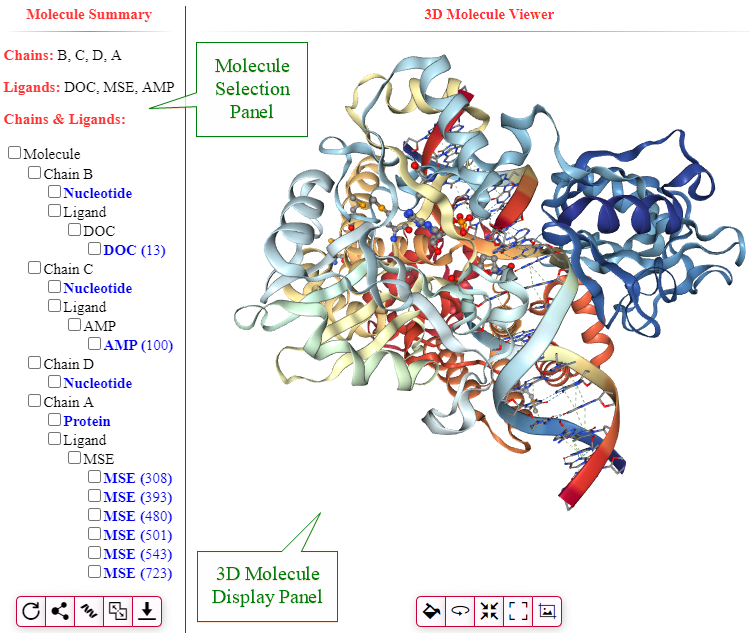
The PDBms result page consists of two panels for analyzing molecules in the PDB file. In the left panel (molecule selection panel), the list of molecules has shown in chains and types of molecules (macromolecule and small molecule). Moreover, the right panel (3D molecule display panel) shows the 3D visualization of molecules on selection.
Molecule Selection Panel
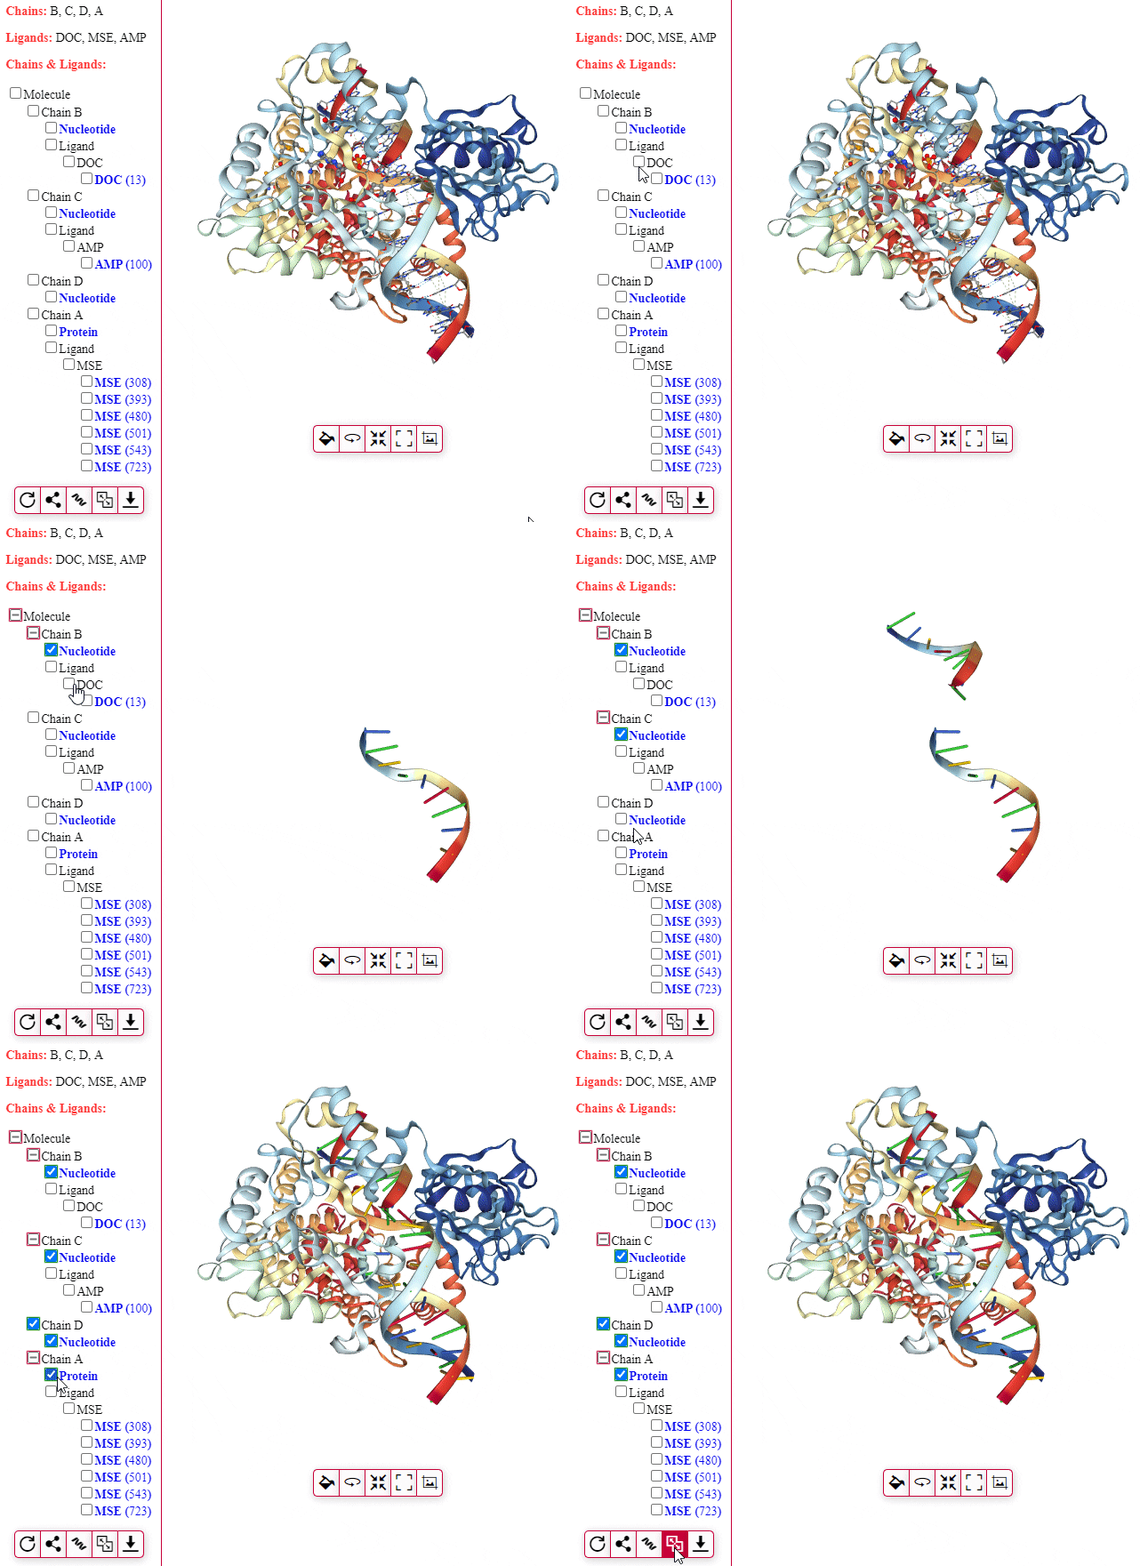
The molecule selection panel consists of a list of molecules with interactive hyperlinks & checkboxes to select molecules. At the bottom of the panel, there are buttons to reset selection, toggle the display of molecule in ball-and-stick/wire-frame representation, toggle the display of molecule in cartoon representation with residue type/secondary structure color, split the PDB file, and download the PDB file.

On molecule selection, the 3D visualization of molecules displays instantly in the ball-and-stick model and CPK color representation.
Molecule Display Panel
The molecule display panel instantly visualizes molecule in 3D on selection. At the bottom of the panel, there are buttons to change background in black/white, rotate molecule in 360°, displays molecule in center of division, displays molecule in fullscreen (also done by mouse left-double-click), and takes screenshot of the molecule in transparent PNG file format and stores to the local disk.

The 3D visualization of molecular models is specific to molecule types viz. DNA/RNA, protein, and ligand. On clicking the hyperlinks, DNA/RNA molecules display in helical strand model, protein molecules display in α‐helix & β‐sheet model, and ligand molecules display in target-ligand interaction model with various representations.
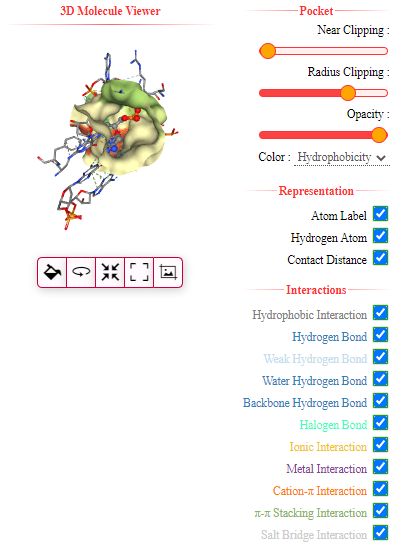
The display of target-ligand interaction model can be customized with various representations viz. pockets, atom label, hydrogen atom, contact distance, hydrophobic interaction, hydrogen bond, weak hydrogen bond, water hydrogen bond, backbone hydrogen bond, halogen bond, ionic interaction, metal interaction, cation-π interaction, π‐π stacking interaction, and salt bridge interaction.
Splitting PDB File
Select the molecules of interest from the list in the molecule selection panel. After completing the molecule selection, click the split button to split the PDB file according to the molecule selection.
Downloading Molecule
Click the download button to download selected molecules in customized PDB file format.
